Consulting Areas
Electrical Load Studies and Capacity Analysis
We typically respond within one business day.
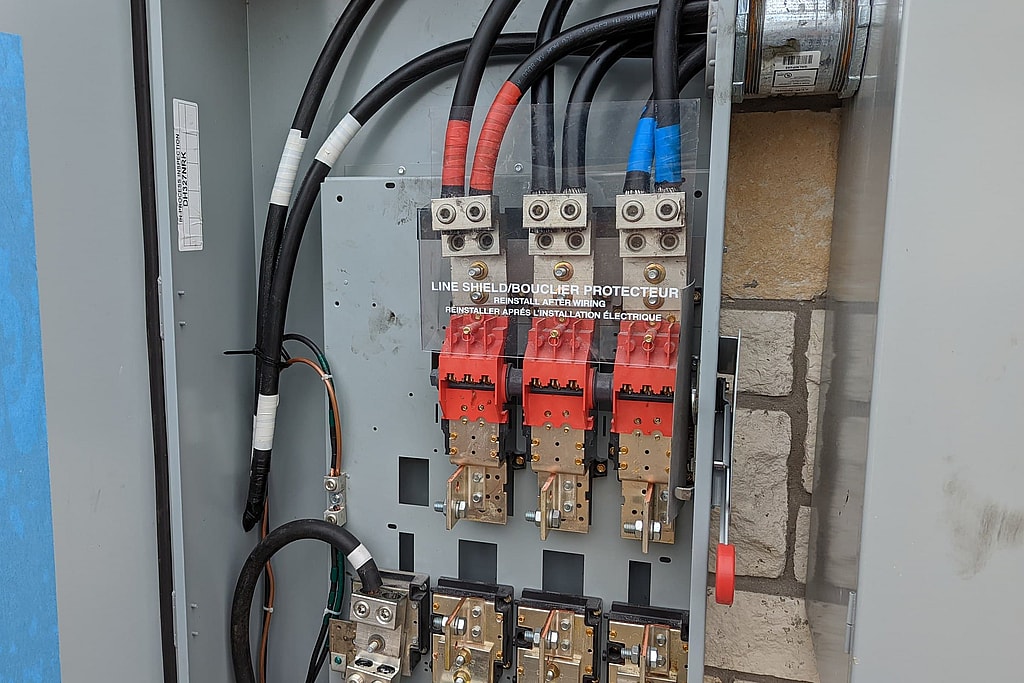
Electrical Load Analysis
An electrical load analysis tells you how much of your system’s capacity is in use, where, and how much is left. We build it from a combination of calculated loads (the connected equipment and its demand) and measured loads (metering or a load recording over time), then compare the result with the ratings of your service, transformers, feeders and panels. The study shows whether you can add equipment, whether phases are balanced, and where a circuit or transformer is overloaded.
For an existing service, the NEC® lets the maximum demand come from a year of utility demand data or, where that isn’t available, a 30-day load recording (NEC 220.87). That is often the difference between a costly service upgrade and finding out the capacity is already there.
A load study measures how much power is used. When the question is the quality of that power, such as harmonics, sags or transients, see power quality and harmonic studies.
Contact us for a free quote. We typically respond within one business day.
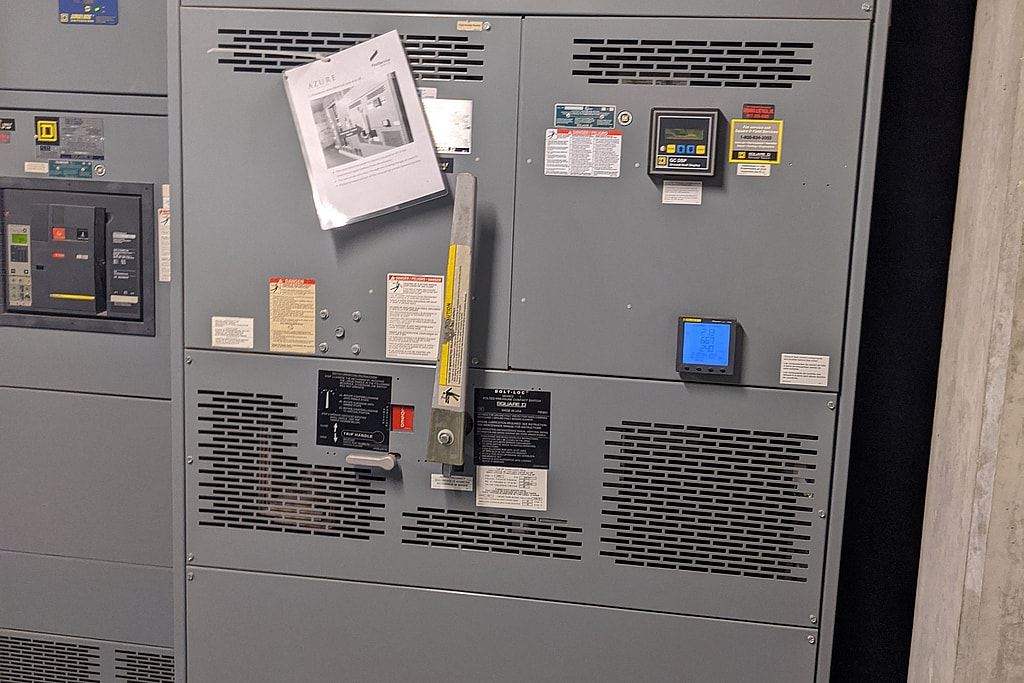
Main switchboard in an apartment building
We perform electrical load analysis, sequence of operation and generator staged-loading designs, including bus transfer schemes and automated control schemes. A complete load assessment starts with an electrical load list and critical load profiles, so you know which loads must stay on, which can be shed, and in what order equipment can be restarted.
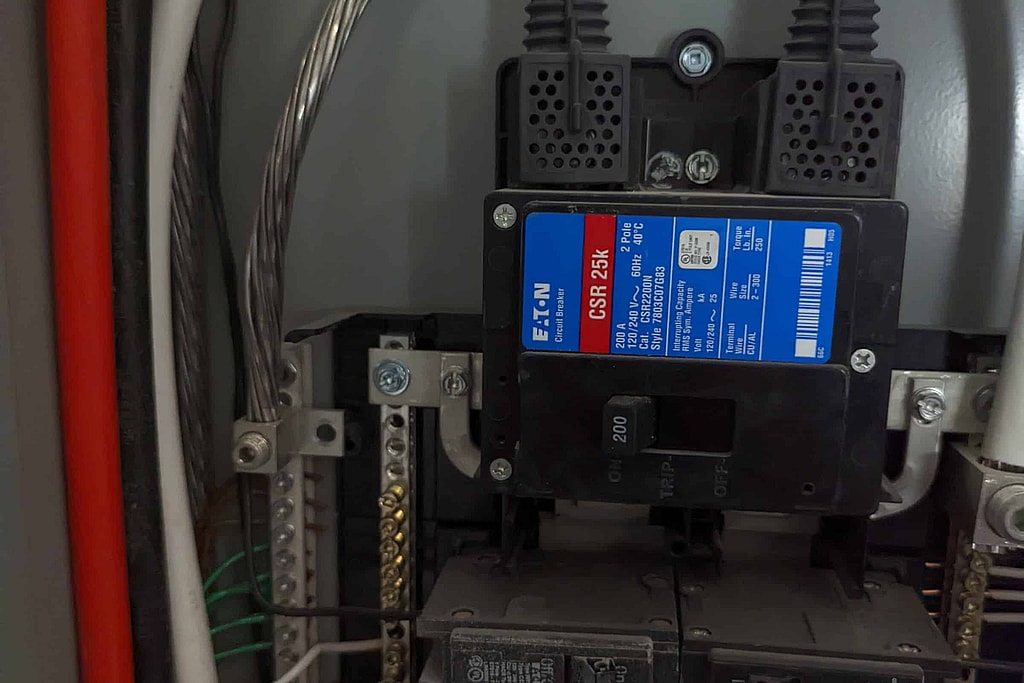
Load center with a surge protective device
We assess your facility’s current capacity and the provisions available for future growth, and troubleshoot systems that trip, run hot or sag under load. Typical findings include unbalanced phases, transformers or feeders loaded beyond their rating, and spare capacity that was never documented. The results feed directly into electrical design for an expansion, or into short circuit and arc flash studies.
HMI & PLC Troubleshooting
PLC and HMI problems often look like electrical faults, and electrical faults often look like control problems. We troubleshoot both sides: control power and grounding, I/O and wiring, communication between the PLC and HMI, and the field devices and signals behind them, such as 4-20 mA current loops. Our article on common causes of PLC control system failure covers where to start.
Residential Customers
Adding an EV charger, heat pump, shop equipment or a solar or battery system can push a home’s service past its rating. We perform residential load calculations to show whether your existing service can carry the new load or needs an upgrade, and we can investigate unexplained high electrical usage or nuisance tripping. See when to get a residential electrical load analysis.
How a Load Study Works
We collect your one-line diagrams, panel schedules, equipment lists and any utility demand data, and record loads on the service or key feeders where the data isn’t enough. From that we calculate connected and demand loads, phase balance and the loading of each transformer, feeder and panel, and report the remaining capacity with recommendations, PE-stamped where required.
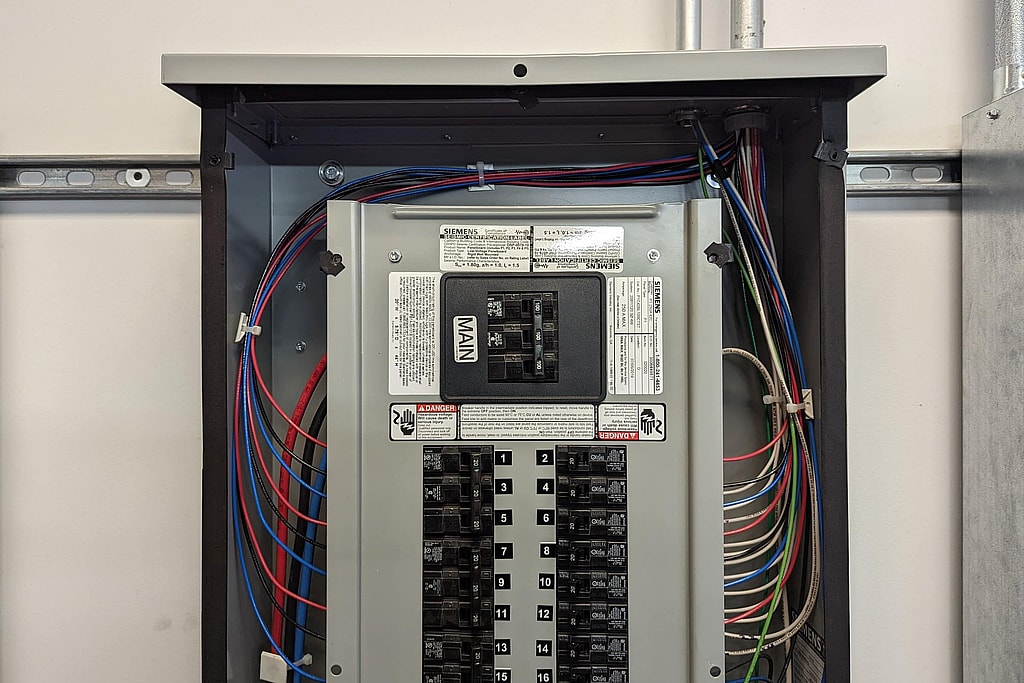
We serve Texas, Louisiana, Oklahoma, New Mexico, Colorado and Florida, and work nationwide.
When you contact us, you talk directly with an electrical engineer who can discuss your project. Our licensed Professional Engineers have active and past licensure in multiple states, our offices are in Coldspring, Texas and Westcliffe, Colorado, and we work nationwide. Deliverables are PE-stamped where required.
Contact us for a free quote. We typically respond within one business day.
NEC 220.87 load study Illustrative
Why a 30-day recording can miss the year’s peak
Under NEC 220.87 (120.87 in the 2026 NEC) the existing load can come from a year of demand data or, when that is not available, a recording of at least 30 days. Move a 30-day recording through one illustrative year and see what it finds, and what it misses.
Each day’s highest 15-minute demand, under 400 A to over 600 A30-day recordingIts highest dayThe year’s highest day
Arrow keys move the recording by one day, Page Up and Page Down by a week. You can also tap a day in the calendar.
Highest day in the window, Apr 28: 15-minute averages
The 220.87 demand test: 125 percent of the highest demand plus the new load
125 percent of the highest demandNew load, 120 AOver the ratingService rating, 800 A
As recorded, this 30-day window meets the 220.87 demand test, but a full year of data does not: the year’s highest demand, 628 A on Aug 13, falls outside the window. 237 of the 336 windows you could pick in this year would meet the test as recorded. That is why the code requires the larger of the heating or cooling load to be included, by measurement or by calculation.
- Highest 15-minute demand in the recording
- 441 A Apr 28, 14:00 to 14:15
- Highest in the full year
- 628 A Aug 13, 16:15 to 16:30
- Recording: 1.25 × highest + 120 A
- 671.25 A Meets the demand test 128.75 A under the 800 A rating
- Full year: 1.25 × highest + 120 A
- 905 A Fails the demand test 105 A over the 800 A rating
Highest 15-minute demand in each month
| Month | Highest demand | Day and interval |
|---|---|---|
| Jan | 511 A | Jan 21, 07:45 to 08:00 |
| Feb | 459 A | Feb 5, 07:30 to 07:45 |
| Mar | 437 A | Mar 6, 13:45 to 14:00 |
| Apr | 441 A | Apr 28, 14:00 to 14:15 |
| May | 476 A | May 22, 14:15 to 14:30 |
| Jun | 548 A | Jun 24, 16:30 to 16:45 |
| Jul | 569 A | Jul 21, 17:00 to 17:15 |
| Aug | 628 A | Aug 13, 16:15 to 16:30 |
| Sep | 545 A | Sep 1, 17:00 to 17:15 |
| Oct | 463 A | Oct 1, 14:15 to 14:30 |
| Nov | 433 A | Nov 10, 14:30 to 14:45 |
| Dec | 483 A | Dec 9, 07:30 to 07:45 |
What 220.87 asks for
The existing load is the actual maximum demand: a year of demand data or, when that is not available, a continuous recording of at least 30 days on the highest loaded phase. The maximum demand is “the highest average kilowatts reached and maintained for a 15-minute interval.” 125 percent of it plus the new load must not exceed the ampacity of the feeder or the rating of the service, and the feeder and service must also have the overcurrent and overload protection that 240.4 and 230.90 require. This explainer shows only the demand test. The wording follows the 2020 and 2023 editions; check the one your AHJ enforces.
Why 30 days can miss the peak
A building’s highest demand usually comes on a few hot afternoons or cold mornings. Thirty days in spring or fall will not see them. So the recording has to be taken while the building is occupied, and it has to include the larger of the heating or cooling load, by measurement or by calculation.
How we set the recording
We time the recording to catch the facility’s normal peak operation. Where the season cannot be recorded, we add its load by calculation and show the method in the report. The 30-day route is not allowed on a feeder or service with PV, wind or any form of peak load shaving.
Frequently Asked Questions
What is an electrical load analysis?
A study of how much electrical capacity a building or system is using compared with what its service, transformers, feeders and panels are rated for, and how much is left for new equipment.
Can a load study avoid a service upgrade?
Sometimes. Measured demand is often lower than a calculation from nameplates suggests, and the NEC allows a year of demand data or a 30-day load recording to establish the existing load (NEC 220.87).
How long is a load recording?
Where utility demand data isn’t available, the NEC method uses a recording of at least 30 days. We set the recording period to capture your facility’s normal peak operation.
Do you calculate generator loads?
Yes. We prepare load lists and critical load profiles and design generator staged loading and transfer schemes.
Related Reading
- NEC 220.87 Load Study: Using Measured Demand to Size an Existing Service
How an NEC 220.87 load study works: a year of demand data or a 30-day recording, the 125% test, a worked example, and mistakes that get studies rejected.
- Understanding Load Analysis in Engineering
Electrical load analysis verifies a power system can safely serve every load: what load studies measure and why facilities need them before upgrades.
- What Is the Load in a Circuit? How to Calculate Circuit Load Capacity
What the load in a circuit is, how to work out circuit load capacity, what a 15 or 20 amp circuit can carry, and the 80 percent rule for continuous loads.
- How Renewable Energy Impacts Electrical Load & Infrastructure Safety
See how renewable energy integration changes electrical loads, fault currents, and arc-flash risk, plus how engineers keep facility infrastructure safe.
Related Services
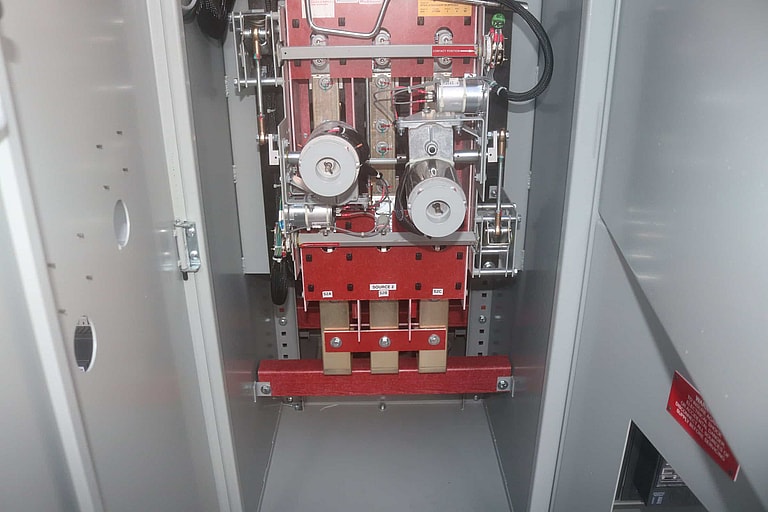
Engineering Design Services
Construction documents, panel schedules and electrical design, PE-stamped where required.
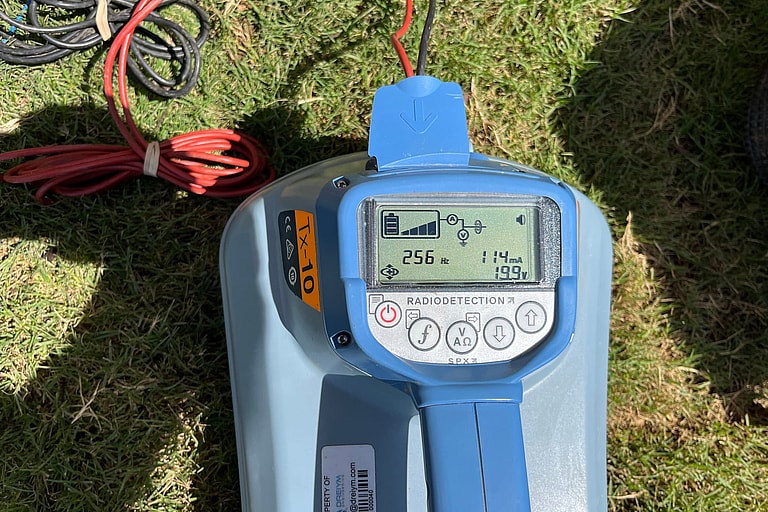
Facility Walkdowns
Facility walkdowns, field-verified as-builts and single-line diagrams.
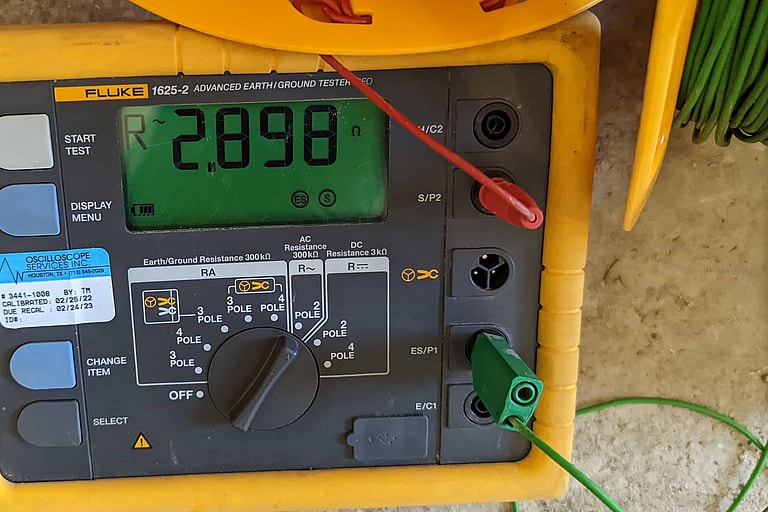
Grounding System Testing
Fall-of-potential and clamp-on testing of grounding electrode systems.
Project experience
Related projects
Austin and San Marcos, TX
EV Charging Build-Out Studies, Austin and San Marcos
EV charging, load studies
Austin, TX
EV Charging Capacity Studies, Austin
EV charging, load studies
Austin and Huntsville, TX
Electrical Inspections of Renovated and Existing Homes
Home inspections, load analysis
Dayton, Strawn and San Antonio, TX
RV Park Service and Feeder Sizing in Dayton, Strawn and San Antonio
Load analysis, feeder sizing
South Central Texas
Brewery Grounding Survey and Power Quality Monitoring
Grounding, power quality
Houston, Galveston and Corpus Christi, TX
Terminal and Coastal Site Arc Flash Studies, Houston to Corpus Christi
Arc flash, harmonics, motor starting
Get your project started
We typically respond within one business day.